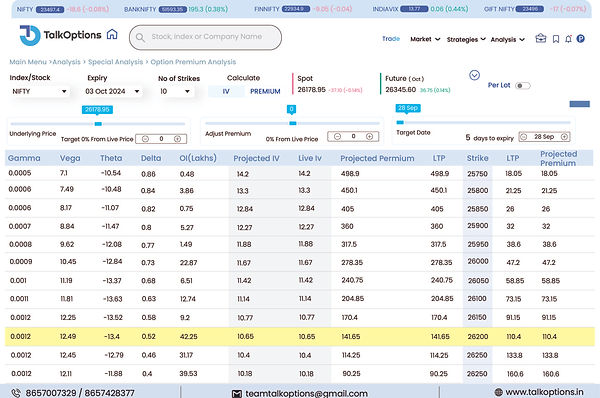
Option Premium Chart | Nifty, Bank Nifty Option Premium Charts | Bank Nifty Premium Chart and Graph NSE | Open Free Account Online and Start Trading Today
Learn in detail about the option premium chart, including how to effectively interpret Nifty and Bank Nifty option premium. Understand what factors can affect their prices, etc. We shall also see how traders can benefit if they start using the tool and how it helps enhance their trading strategies in the NSE market


TalkOption’s Option Premium Charts : A Detailed Analysis
The options trading is all about analyzing the numbers and taking relevant actions accordingly. Some find it difficult to analyze the numbers, and thus, to ease them in analyzing Talkoptions, they have charts or graphs. Charts are easy to interpret and help in quick decision-making. One such important chart is the option premium data chart NSE, which shows the amount of premium (receive or pay) upon buying or selling the option contacts. Regardless of the underlying asset in the contract, nifty or bank Nifty, understanding the nifty and bank Nifty option premium charts is a must. It offers detailed insights about the price of the contract to make informed trading decisions.
What is Option Premium Chart Analysis ?
Option Premium chart analysis is a process of tracking and analyzing the movement of option premiums over a period. The premium is the price an investor is willing to pay while buying a contract and receive while selling a contract. Many factors, such as the price of the underlying asset, market volatility and implied volatility, prevailing interest rates, etc., can influence this price.
Many traders use nifty and bank nifty option premium charts or graphs to visualize and interpret the price movements, and make better strategies. For example, the bank nifty premium chart helps traders the first thing that is the ideal entry in the NSE market and also helps them choose the best exit.
Learn the Factors that Affect Option Premium
A number of factors impact the premium value of options; thus, it is important to understand them using Nifty and Bank Nifty option premium chart or graphs
-
The price of the underlying asset has a great impact on options premium prices.
-
Expiry time, also known as the time decay factor, also affects the premium pricing.
-
High market volatility often leads to a rise in the premium value as the chances of option expiring in-the-money increases.
-
The change in interest rates also affects the pricing, especially if the contract is long-term.
-
Many traders forget about this major factor—the demand and supply of the underlying asset; the higher the demand, the higher the premiums.
All these factors are visible in the Talkoptions NSE option premium charts, thus making it a must have tool in the trading basket.
Features and Benefits of TalkOption’s Options Premium Analysis Tool
By using advanced option premium chart analysis tools such as Talkoptions, traders can get deeper insights and learn their trends. Below listed are some of the other features traders get from this nifty and bank nifty option premium analysis tool
1) Real-time data updates
Just like the prices of the assets, the premium prices also change rapidly. Therefore, having real-time data updates features helps a lot to stay updated with the market.
2) Best Visualization
This tool offers the best visualization and interactive charts or graphs, which makes identifying the trend easy.
3) Offers Historical Data Analysis
With the help of historical data, traders can backtest their strategies and be sure of the outcome. Bank Nifty premium chart and Nifty option premium chart help analyze the market condition and make better decisions.
4) Custom Alerts and notification
Traders can set custom alerts and notifications based on their preferred criteria to act proactively and seize every best opportunity.
5) User-friendly Interface
The tool is easy to handle, even for the new traders. They can start interpreting from day one without any hassle.
6) Talkoption’s Options Premium Calculation Methods
Talkoption’s take into consideration the combination of Black-Scholes model and real-time market data NSE. This method allows the accurate calculations of premium prices by considering all factors that might affect the pricing.
How do Traders Benefit from the Option Premium Chart Analysis Tool ?
All traders who use nifty and bank nifty option premium chart analysis tools greatly benefit from it. Some of the major benefits are listed below :
1) Enhanced decision making
When traders have better visuals and the ability to interpret them correctly, they can make better trading decisions.
2) Risk Management
Observing the changes in price trends helps traders manage the risk effectively. Any sudden surge in price can alert traders to take action as per the NSE market.
3) Profit Optimization
Identification of the right entry point, exit point, historical data, etc. all combined together help traders to maximize their profits.
4) Strategic Planning
Option premium charts act as a reference point for planning for advanced strategies such as straddles, strangles, and various spreads.
5) Modification of the position according to the NSE Market
With such tools and analysis, traders can better align their strategies per the current NSE market.
Conclusion
Lastly, the NSE option premium charts are a very effective and useful tool for every trader in India. Whether you are trading with the Nifty or Bank Nifty, the Nifty and Bank Nifty option premium chart or graphs help traders visualize the movements. Traders can relate these market movements to the latest news, their strategies, and their risk-bearing capacity to optimize their trades.
